multifactorial traits show up at birth and through adulthood
influenced by genetics, environment, chance (hypertension, obesity, cancer)
Model systems for dissecting complex phenotypes
inbred mouse strains: selective breeding for > 20 generations yields mice that are homozygous at every locus
every same-sex mouse of an inbred strain is genetically identical
Þ
phenotypic differences must be environmental or stochastic
i.e. two strains of mice A and B
Þ bp of A = 140 - 160 mm and bp of B = 120 - 140 mm
intrastrain differences are non-genetic; interstrain differences are genetic
Quantitative Strain Analysis: interstrain mating in order to follow the trait
Þ leads to mapping of the trait to a locus or loci
Quantitative Trait Loci: loci that have been mapped and identified to contain the trait (i.e. bp in the above example)
Approaches for dissecting complex traits in humans
twin studies
monozygotic twins share 100% of their genes; dizygotic twins share 50%
purely genetic traits should have 100% concordance in monozygotic twins and less in dizygotic or siblings
50% for single dominant locus; 25% for single recessive locus
purely environmental traits will have the same concordance rate in monozygotic and dyzygotic twins
familial aggregation studies
first degree relatives share more genes than second or third degree
if a trait is genetic, it should be shared by more first degree relatives than third - assuming the same environment
also, family members should be more at risk for the trait than the general population, controlled for environment
relative risk: used to compare populations; degree of risk an individual has as compared to another individual or to a segement of the population or to the general population
relative risk can be calculated for both genetic and non-genetic factors (i.e. smoking, etc)
relative risk = individual risk / population risk
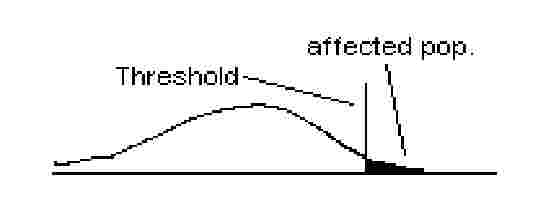
The Multifactorial Threshold Model for Complex Diseases
people who share certain alleles or environmental factors have similar disease liabilities; if their liability surpasses a certain biological threshold, then they will develop the disease
outcomes predicted by the multifactorial threshold model
recurrence risks represent averages for all families since each proband within a family can have a different liability (each affected person is above threshold, but not necessarily to the same degree; use average)
risk for an individual increases with each affected member of the family
the overall liability is likely to be higher in families with multiple affected members
relative risk (for a family member vs. the general population) is inverse to disease frequency
i.e., if a person has an 80% risk for a disease with 5% incidence so relative risk = 16
if a person has an 50% risk for a disease with a 0.01% incidence so relative risk = 5000
diseased people who have a higher biological threshold are more likely to have affected relatives
a person with higher threshold must have a higher liability; relatives must also have higher liability
Finding loci which contribute to liability
similar to using Mendelian segregation analysis but more complex
Þ higher LOD scores
test for deviations in allele sharing among concordant/discordant siblings, etc
Ethics
eugenics: improvement of the human species by decreasing the propagation of ‘undesirable’ traits